Reports.
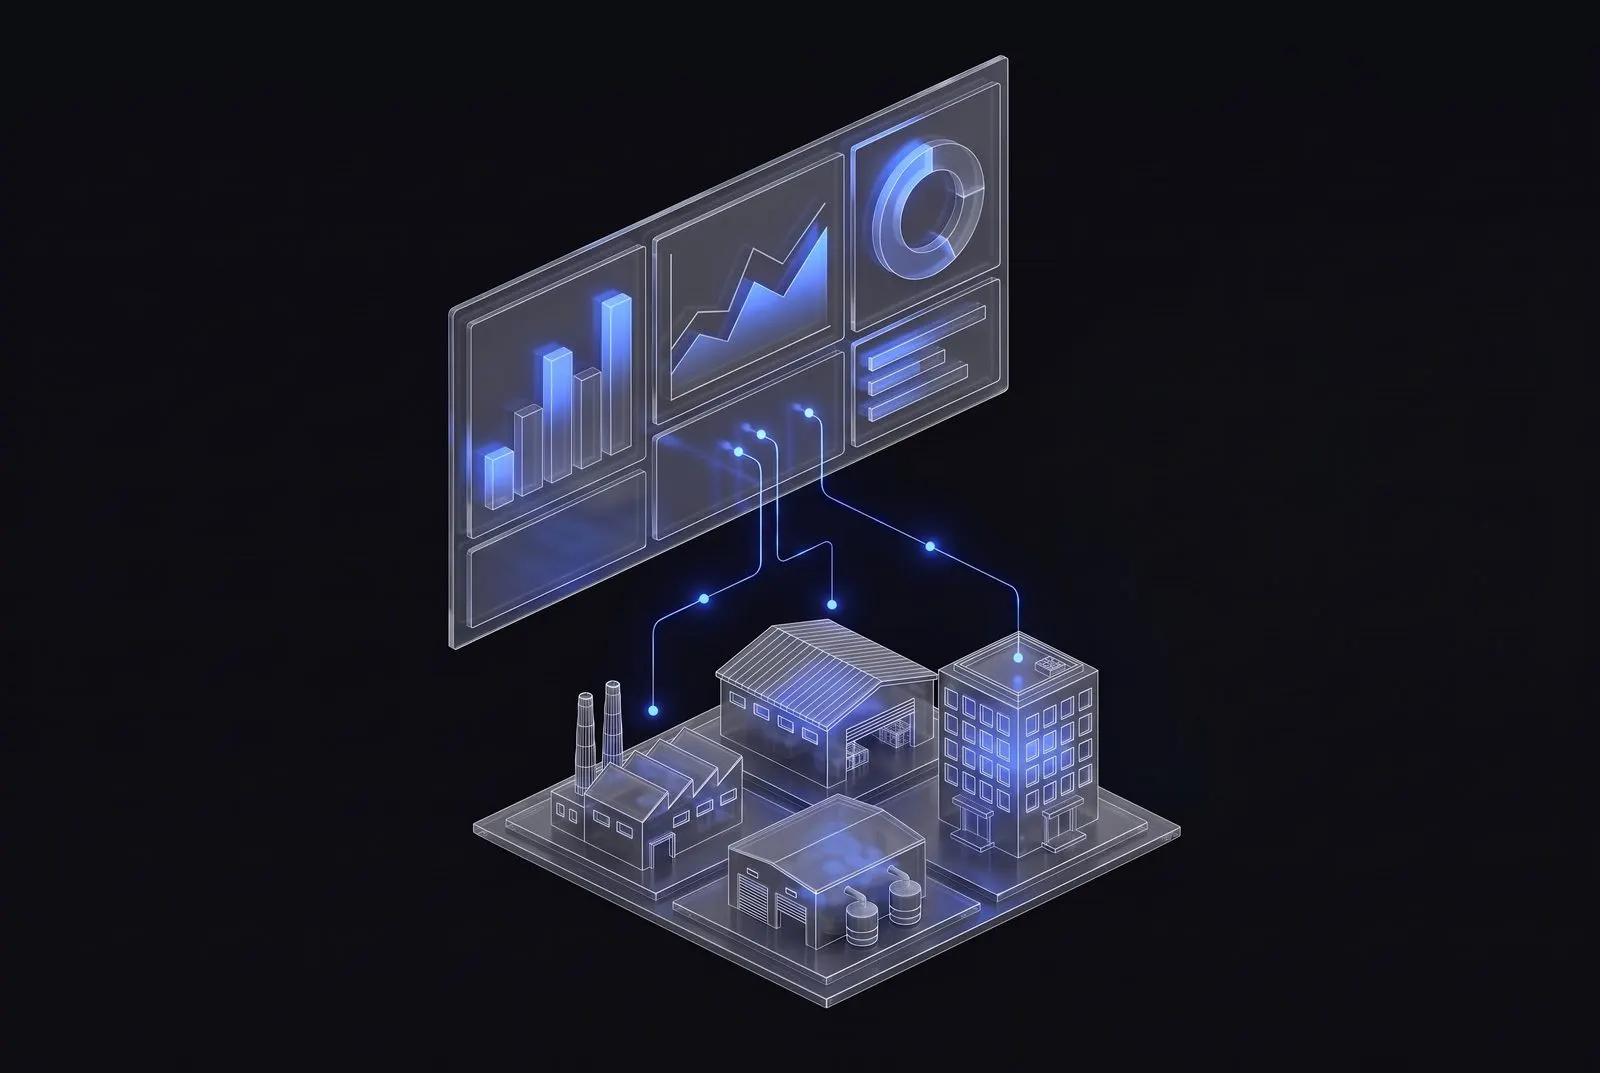
Company results, updated as you work.
Sales, production, stock and receivables on one screen, calculated from data the team enters anyway. The board does not wait for a month-end summary pieced together in Excel.
- Key company metrics in one view
- Data current during the day
- Drill down from a metric to the details
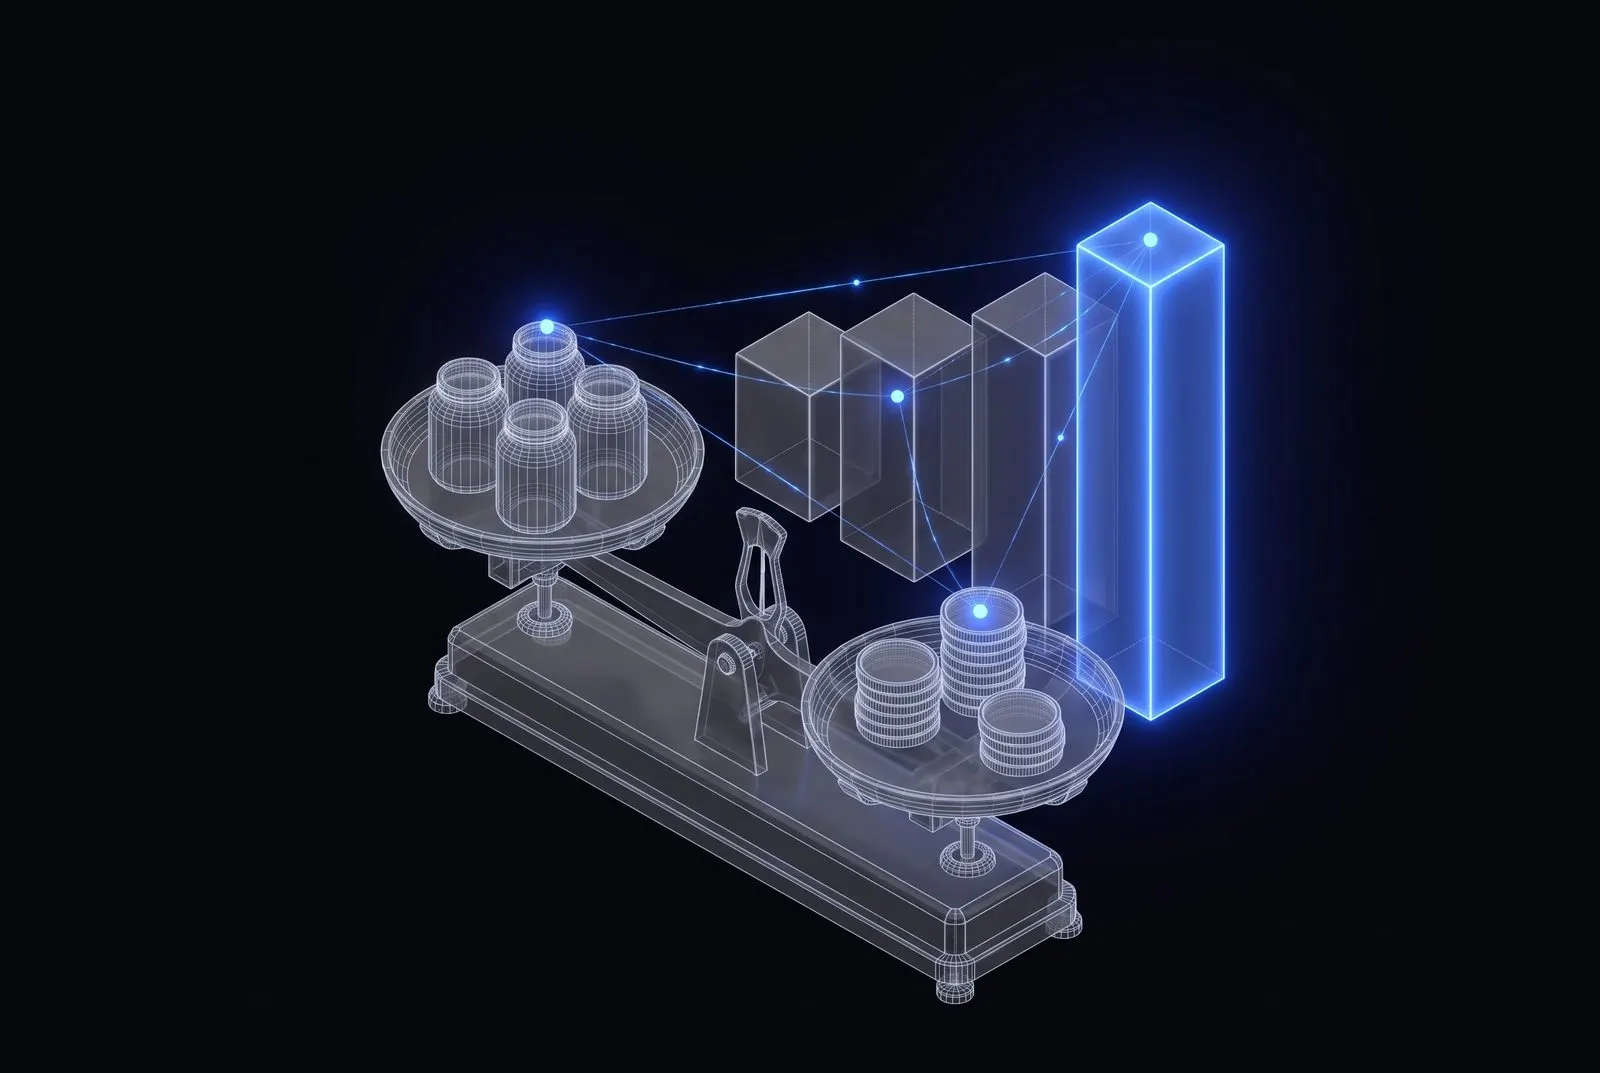
Margin calculated per product, customer and sales channel, with raw material cost from the recipe and selling costs included. You see which products earn money and which only add turnover.
- Margin per product, customer and channel
- Raw material cost from recipes
- Products and prices to review
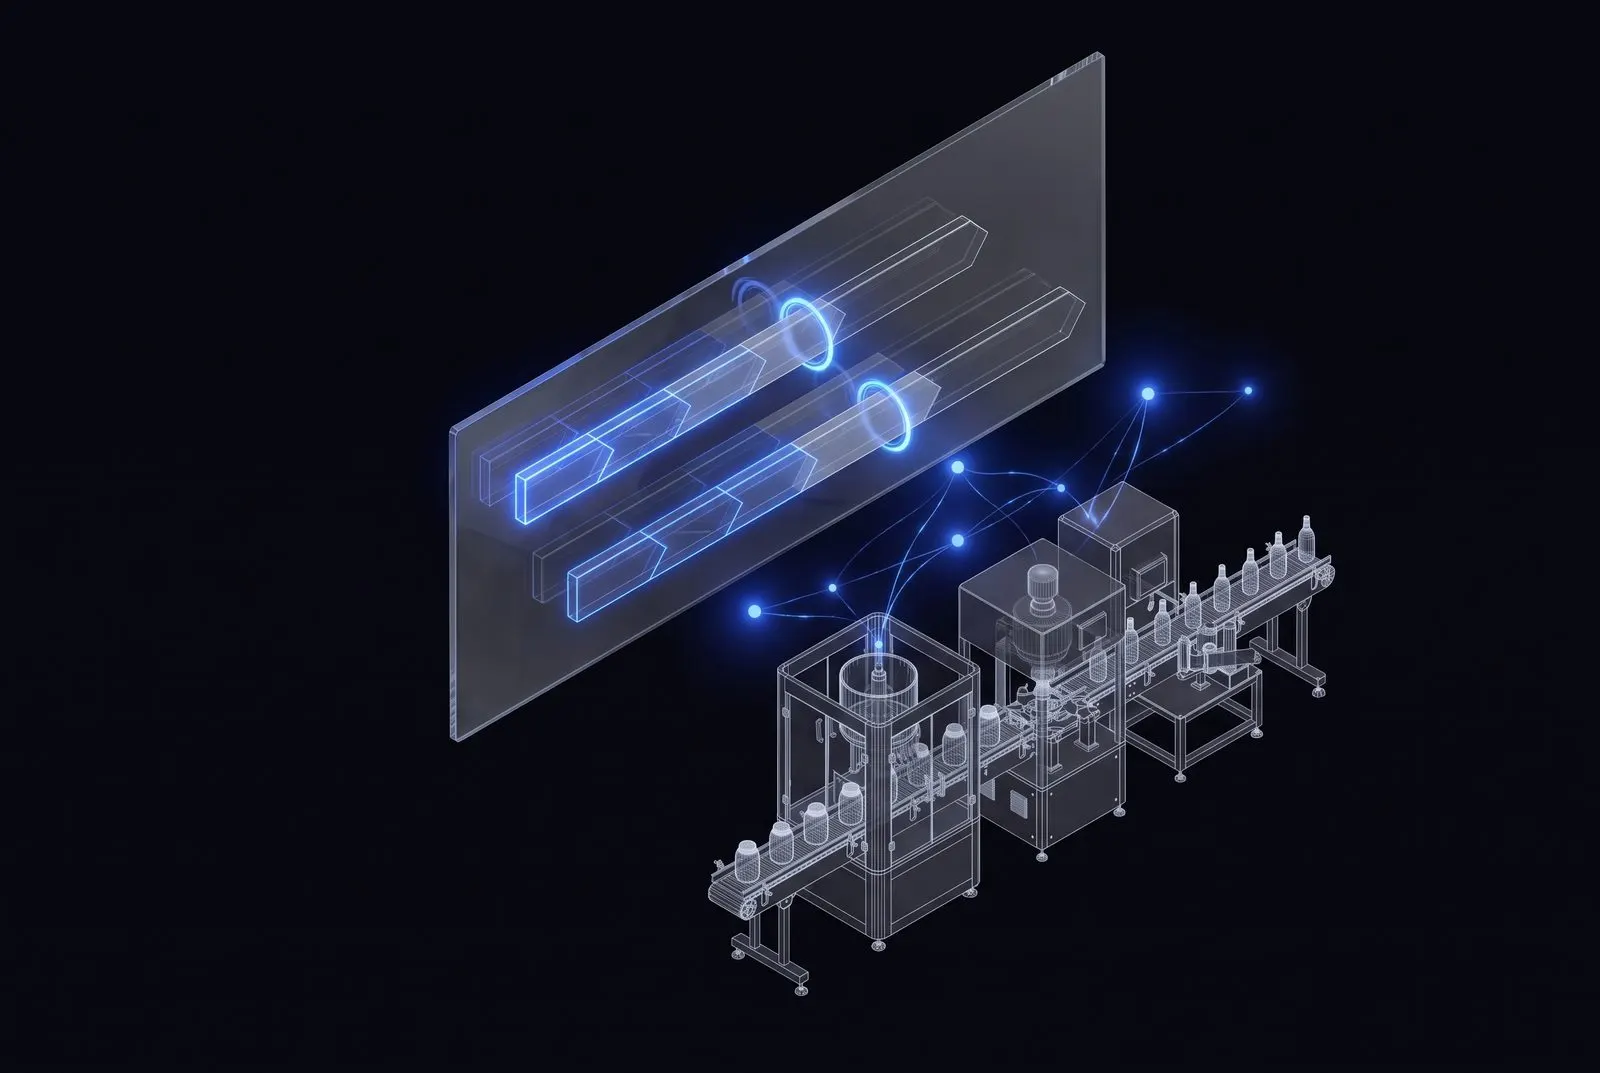
The production plan set against actual output on every line and shift, with the reasons for any gaps. The manager sees a delay during the week, not in the monthly report.
- Plan and actuals side by side
- Deviations with reasons
- Line utilisation and downtime
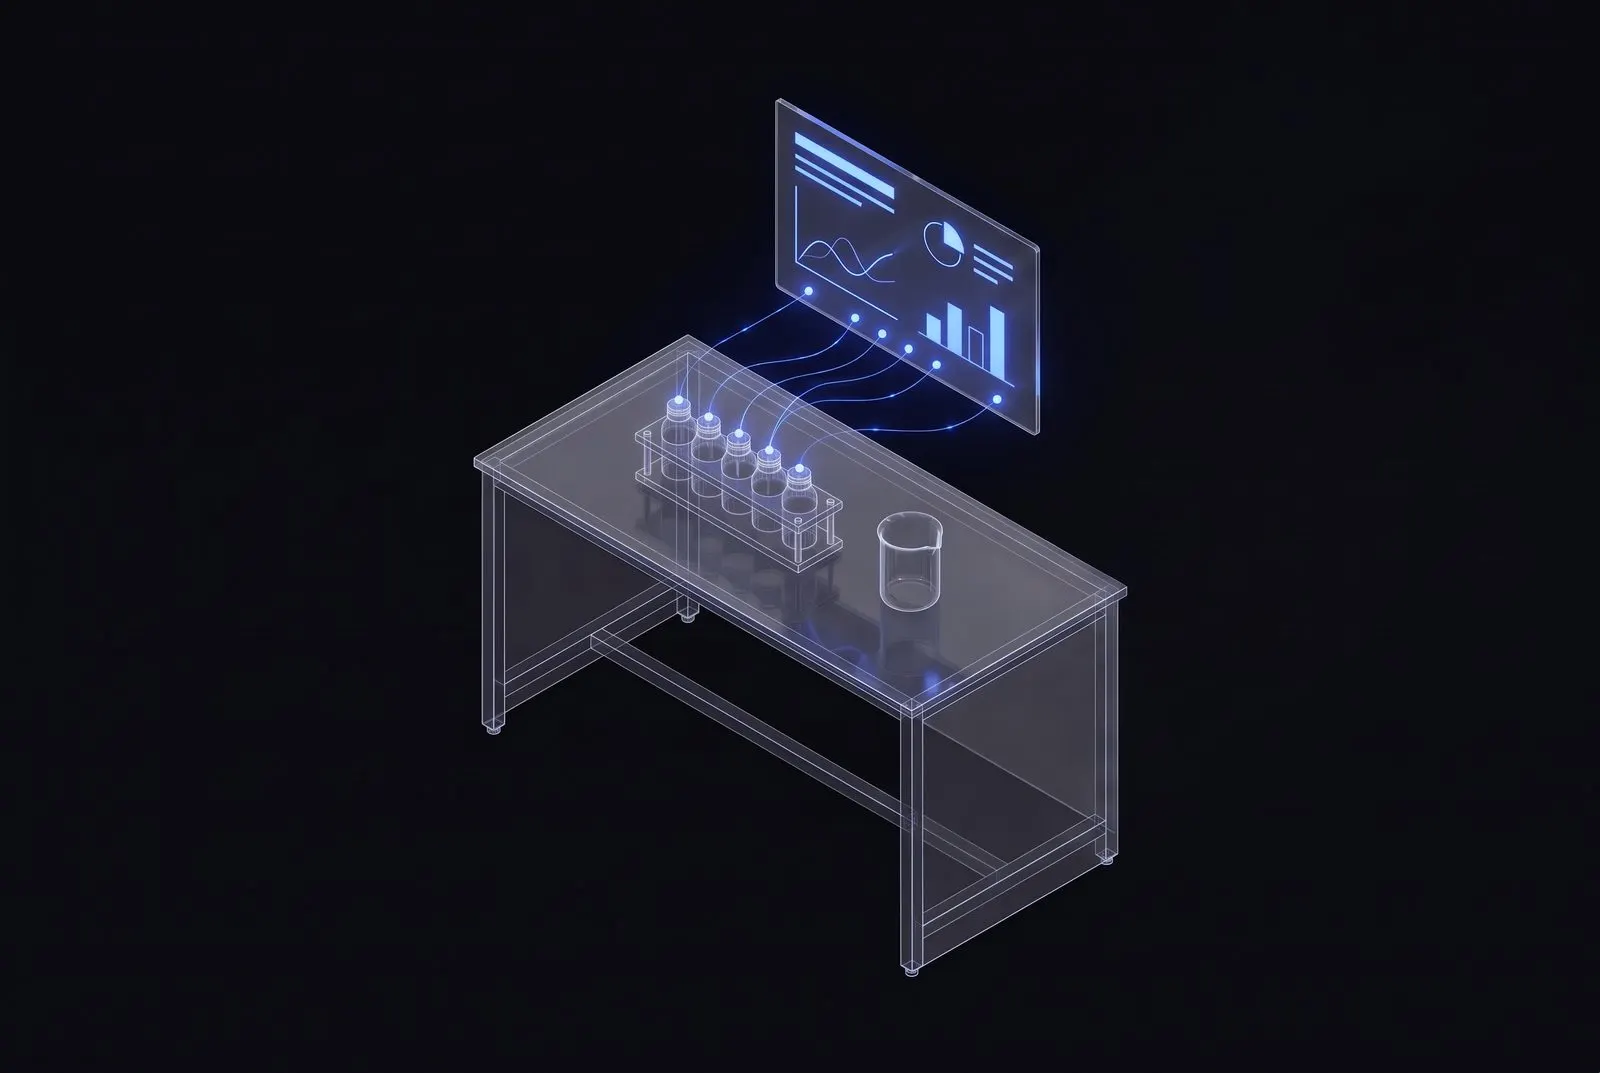
Samples, tests and recipe versions from R&D are collected in reports with their results and decisions. Product development history does not get lost in lab notebooks and email.
- Samples and tests linked to the product
- Recipe version comparison
- Decisions and results in one report

Let's see what AI can do in your company.
Companies that adopt modern systems now will be a step ahead of their competitors in a few years. Start with one process, and we add the rest in stages.
Book a call →